Warning: This is a very complicated and math heavy post. It is best read slowly in small doses to ensure you can fully digest it all. I will also point out that I’m not a math or analytics expert so what you get here is my way of doing things which is probably far removed from the official Geek’s Guide to Web Analtyics and PPC Tracking.
In Part 1 of this 2-part series I guided you through some basic calculations that help you figure how to ensure that your PPC campaign is profitable by knowing your cost per conversion ceiling. The calculations I went through were very basic and provides a good starting place for any new or inexperienced PPC campaign manager. In this post I’m going to take you a bit deeper into some much more complex calculations in an attempt to get more accurate cost per conversion data.
The cost per conversion ceiling found when doing the calculations in Part 1 will actually be much lower than the final calculations we’ll produce here. Using the figures from the beginners post will leave you less room to maneuver on campaigns where costs are high and profiting is seemingly more difficult. We’ll fine tune things quite a bit here in order to give you more wiggle room while ensuring your PPC efforts remain profitable in the long run.
Every customer has a value beyond the first sale
Every sale you make is worth more than the cost of the products or services charged in that one transaction. You’ve heard it said it costs more to find a customer than to keep a customer. PPC and SEO is all about finding new customers. But if you run the business right, you should be going out of your way to keep the customers coming back time and time again.
The question is, from now until death, how many customers come back for repeat orders? How often and how much do they spend? Every industry is different. Where Amazon likely has customers come back monthly, weekly, and some even daily; car dealership only gets customers back every few years if at all.
If your average customer comes back five times over the course of their life and spends an equal amount of money, then each customer has a lifetime value of five. Technically, that means that if the cost of acquiring a customer (the PPC’s cost per conversion) is four times the profit you make on a single sale, you’ll still make a profit on that fifth sale.
That’s putting it simplistically. Different products may make different impacts on the visitor. Higher-end stuff may bring customers back less because there is no immediate need to replace it, but also brings back loyal customers that are apt to make more purchases. Lower-end stuff may need to be replaced more frequently, but also prone to disappoint your customers, making it less likely to produce repeat sales.
Finding the lifetime value of a customer isn’t easy to predict. If you have access to all your sales data, then you can run the figures to get the bottom line. We’ll continue to use our fictitious company Sexy Doodads, Inc, to provide our data.
In Part I we found out how many customers purchased each product within the last 12 months. So now we look into the books to find out how many actual customers Sexy Doodads, Inc has for each product. This is what the books tell us:

To find the value of each customer within a one-year time frame you take the total number of sales for any product group and divide that by the total number of customers. From Part I we know the total number of sales for each Sexy Doodads, Inc. product group so we’ll plug that information into our calculations here.

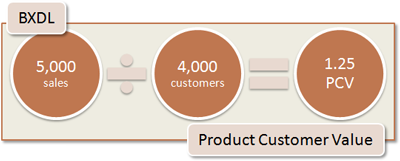

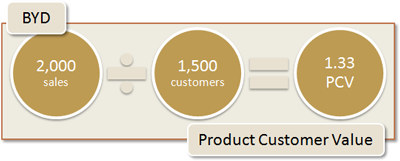

This tells us how many purchases each customer makes from within the same product group in an average year.
By adding up all the sales for each product group and all the customers, Sexy Doodads, Inc. finds that they received a total of 17,500 sales from 15,500 customers. That means 2,000 customers bought more than a single products from within the same product group.
These are great figures to have if each customer only buys from a single product group. But that’s not always the case. What we don’t yet know is how many customers might have purchased multiple products across differing product groups; perhaps on a subsequent visit. So now we look at total orders and total customers over the same one-year.
If Sexy Doodads, Inc. looks at their sales figures they can find out how many total unique customers they had in the past year. Lets say they had only 5,000 truly unique customers. (People like to have a lot of doodads!)
Now we’ll do the same we did above to find the yearly customer value of all products:

This tells us how many purchases total each customer makes in an average year.
Since products are sold one at a time and the service is set up on a yearly plan, we’ll need to break the service portion out from the rest of the calculations here and work on those later.
Using the Product Customer Value for all products that assumes that those that come in on the higher profit products will continue to produce a higher profit. Similarly, it assumes that those that come in on lower profit always buy lower profit. To create a better profit balance I would average the Product Customer Value for each product with the PCV for all products.


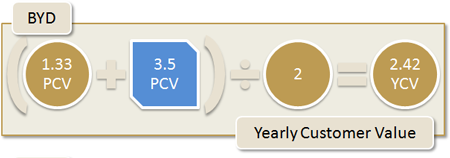

We now have a decent yearly customer value to work with. Those small differences in Yearly Customer Value between products may not seem like a much, but when you’re dealing with large scale they do add up. Also keep in mind that our numbers are fictitious, you may find larger differences in your own business.
The next step is to factor in how many years a customer remains faithful to your brand and continues to make purchases. If you have the data you can perform the above calculations using three, five or ten year period instead of just one year. Ultimately that will be less work, but in case you don’t have that kind of data we’ll use the one-year data and calculate for annual customer loss.
Sexy Doodads, Inc. knows that only about 50% of it’s customers this year will purchase a product next year. Continuing at that rate of loss; only 25% will purchase a product in the third year, 12.5 for a fourth year and 6.25 for a fifth year. We’ll assume that six years after the first purchase all customers have regrettably forgotten about Sexy Doodads, inc. Sad really.
If we add up those percentages together we get a Lifetime Customer Value for all product.
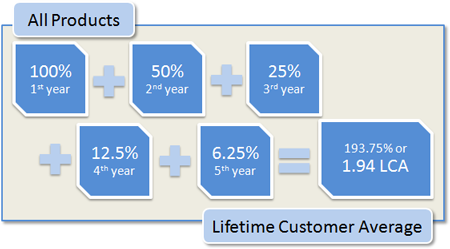
To get the Lifetime Customer Value of each product we multiply the Yearly Customer Value of each product with the Lifetime Customer Value of all products.


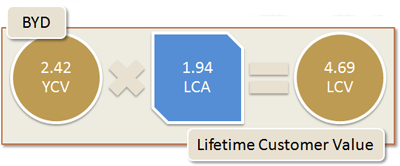

We know know the lifetime value of any given customer, on average, for each product group. As noted above, these figures will vary from industry to industry based on expected repeat sales. We’ll work those figures into some additional calculations later, but lets go back a bit and get caught up with the Doodad Repair Service.
Sexy Doodad, Inc. sells their Doodad installation and warranty service on a three-year contract. Purchasers pay each year for the service for three years and then they are done.
Since the purchase of the doodad installation service is entirely contingent of having already purchased a Doodad from Sexy Doodads, Inc, we don’t have to make any considerations as to how many other products the customer might also purchase. This means the product customer value is also the yearly customer value.

But we do have to figure the lifetime customer value, which, in this case is pretty simple. The purchaser makes three payments of equal value for three years. So we know that the Lifetime Customer Average is 3. We multiply that time the yearly customer value as we did above which gives us the Lifetime Customer Value.

So now we have the Lifetime Customer Value for all of Sexy Doodads, Inc. products and services:

You may be wondering why it’s important to do all that complicated math. It all comes down to profit. Knowing the lifetime customer value allows you, if necessary, to make your first sale at a loss knowing that you’ll make a profit with subsequent purchases. Clearly the goal is not just to break even or take a loss on any sale, but you need to have solid figures so you know where your true profit line is.
I should also note that in some competitive industries, it will take some time to get your PPC campaigns to a profitable level. If you have a better idea of your profit line then you will be more likely to give your PPC campaign a chance to succeed. If you do so much as break even on the first customer that comes via PPC, every additional purchase they make will be all profit. We want to use this information to help establish our baseline metrics.
How much can you spend and still profit?
The next step is to figure out how much you can spend on your PPC ad campaigns and make sure you are making–not losing–money. If you use the profit values we found in part one of this post you’ll stay well within your profitable zone. But again, in competitive industries, that’s not always easy. So we use the results from above to give you a bit more wiggle room in truly figuring out your profitability zone.
To do this you need to multiply the profit from each product (see Part I) by the lifetime customer value. This will tell us how much we might be able to spend on each sale and still make a profit.

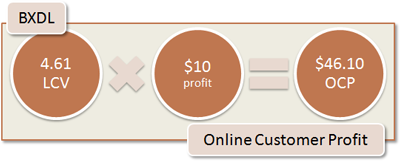


The online customer profit we calculated here can replace the profit that we calculated in Part I as this is far more accurate. You can see how when attempting to adjust your PPC campaigns to stay in that zone of profitability you have a lot more room to maneuver.
But we’re not quite done. To make these figures even more accurate you have to factor in how many sales come over the phone verses through the online forms on the web. This is extremely important. Tracking web clicks and conversions only covers part of your sales. Many people may find you on the web but the conversion happens over the phone. If you don’t account for these then you are leaving out important metrics from your profit calculations.
If you have a call and conversion tracking in place then then you can easily tie these into your PPC metrics and run the math. If not, then you need to estimate how many sales are made via the phone.
Sexy Doodads, Inc. takes about 35% of their orders over the phone. They figure that roughly 15% of those can be tied directly to their PPC efforts. It’s a bit of guess work determined via customer conversations, but its as accurate as Sexy Doodads, Inc. can get for now. We need to add in that 15% to the online profit metric we calculated above.


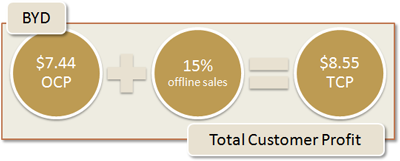

If you want to get really fancy you can figure your percentage of offline sales for each product group. It takes a bit more offline tracking to do that but it will give you more accurate figures on a product by product level.
Remember, it costs more to get a customer than it does to keep a customer. You can increase your profits significantly if you can get each of your PPC campaigns into a profitable range then place some additional efforts on customer retention. If Sexy Doodads, Inc can improve their retention from 50% a year to 75% (only 25% cutting out each year) then the total customer profit of each of their products goes up significantly.
Finding the sweet spot of profitability
Not every click results in a sale. Too many people managing PPC campaigns focus on the cost per click and determine that their campaigns either are or are not profitable. This is a mistake.
Using the tools in your analytics package you can figure out your cost per conversion on a product by product basis. If your cost per conversion falls below the total customer profit, you’re going in the red. The total customer profit is your break even point several years down the line. Ideally you want your cost per conversion to be down 25-75% from the total customer profit. This gives you a lot of room to maneuver as you try to get your PPC campaigns at maximum performance.
Taking the total lifetime profit of each product and reducing it by 75% and 25% we now have a profitability range in which to maintain the cost per conversion of each product in the PPC campaign.

Your sweet spot will likely be right in the middle of those. If you go too low on your cost/conversion you’ll be losing out on potential sales. Increasing your cost/conversion will lower profits per sale but it’ll bring in more sales thereby increasing your profits overall.
As long as you keep your cost per conversion in that range of profitability, it doesn’t matter how much you’re paying per click… or how much you’re spending on PPC. Each click and every dollar spent is more profit in your pocket.
