At first glance, it may seem like the world of online marketing is currently in the throes of transformation. The internet used to be filled with blog posts, white papers, and more — all of which seems to be slowly being replaced by flashy images, infographics, and other forms of data visualization.
However, this “change” is nothing new at all. Visual marketing is a concept that has existed for as long as marketing itself has been around. It was popular before the internet ever existed and will continue to be popular long after. A lot of this has to do with why human beings are so receptive to visual content in the first place.
Humans Are Visual Creatures
Part of the reason why infographics are so popular is because visual content itself is amazingly effective. A number of important statistics shed light on this concept:
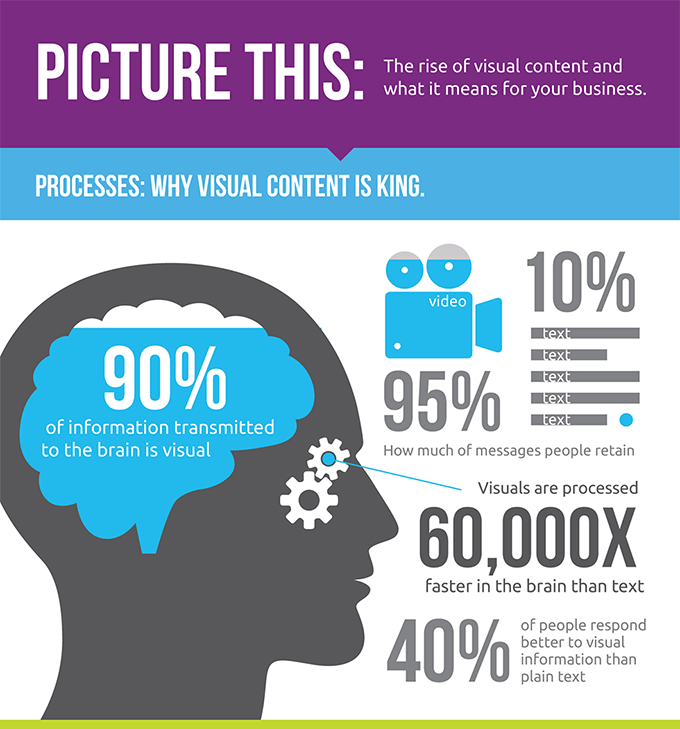
- Visual content is processed by the human brain 60,000 times faster than text-based content. This is true even when an image and a block of text are both conveying the same basic idea.
- 90% of ALL information that is transmitted to the human brain throughout the course of a day is visual. Verbal communication is always important, but visual information will always be king.
- Studies indicate that 40% of people actually respond far better to visuals than they do to text. Everything gets easier — from how that person accepts an idea to how easy it is for that same person to follow directions.
- Almost ALL human communication is nonverbal — to the tune of 93%. Despite the fact that we’re one of the only creatures on the planet to actually develop verbal communication as we define it, it still isn’t (nor will it likely ever be) the primary way that we share ideas with one another.

Visual Marketing Isn’t Just Effective – It’s REALLY Effective
Based on the above, it makes a great deal of sense that visual marketing isn’t just effective because it’s popular — it embraces how the human brain actually works in the first place. Take infographics, for example.
A number of studies have been conducted that confirm that when information is paired with a relevant image, people actually pay more attention to the text itself. Eighteen percent of total viewing time was spent on the image, while 82% was spent on the associated text. This means that even the act of including an image at all can get more people to pay attention to your message than they would otherwise.
All of this leads to a situation where stats like the following are helping to shape modern-day digital marketing campaigns:
- Infographics in particular get more engagement on social media than any other type of content. They’re more likely to be “liked” and are three times more likely to be shared.
- B2B marketers are using infographics more and more. Use in this space saw a 50% increase from 2014 to 2015 and another 58% increase from 2015 to 2016.
- Even if you don’t want to invest the time in making something like an infographic, images can still be hugely beneficial. A Facebook post with one or more images will garner you 2.3 times the engagement than the same post without images.
- According to Xerox, the strategic use of color can both increase a reader’s attention span by 82% AND improve brand recognition by up to 80%.
What’s In an Infographic?
How the human brain processes and breaks down visual materials is something that you’ll need to keep in mind as you set out to design content of your own. Take infographics, for example. Though the format itself will do a lot of the heavy lifting for you, there are still infographics out there that people have no interest in or that aren’t successful.
As you use a tool like Visme to help incorporate more visual content into your marketing collateral, you’ll want to keep ideas like these in mind. Again, according to Xerox, information can be located an incredible 70% faster if it’s in color versus black and white.
So if you color-code the information on your Infographic based on the ideas you’re trying to present (something that Visme allows you to do), you can help guide a reader from one end of the journey to the other.
Also remember that infographics don’t exist in a vacuum. They have an important role to play across your entire campaign. They don’t replace other elements. Instead, they complement them.
According to Social Media Examiner, 74% of marketers currently use visual assets like infographics in their social media marketing. Likewise, Quick Sprout estimates that infographics on a blog can generate an incredible 350,000 readers PER MONTH if they’re utilized effectively.
The Visual Road Ahead
The CMO Council reports that, 65% of senior marketers believe that visual marketing is THE most important element with regards to how their brand story is communicated to the masses. Thirty-nine percent of those marketers feel like they need a bigger budget for visual collateral than they already have, while 35% are continually searching for a better way to manage those visual materials across their entire enterprise.

None of this means that visuals are a replacement for your text-based marketing content. Rather, you should use visual marketing materials to complement written material and lift up your ENTIRE campaign across the board.
It’s also important to understand that none of these ideas are new ones. Embracing visual marketing like infographics doesn’t mean that you’ve stumbled onto some secret weapon that will finally get your collateral the attention it deserves.
It means that you’re taking advantage of something that has been true for centuries. Human beings are visual communicators. They always have been and they always will be.
